from flask import Flask, render_template
app = Flask(__name__)
@app.route("/") #主页
def index():
#代码略
@app.route("/previous") # “往年去向”模块页面
def pre():
#代码略
@app.route("/colleges") # “院校介绍”模块页面
def introduce():
#代码略
@app.route("/volunteer") # “志愿预测”模块页面
def dream():
#代码略
if __name__ =="__main__":
app.run(host=" 192.168.31.125",port=8080)
若登录该系统,想查看院校的介绍,则访问该子页面的URL地址是。
import pandas as pd
import matplotlib.pyplot as plt
plt.rc('font', **{'family': 'SimHei'})
df = pd.read_excel('C9.xls')
g = df. .mean()
g = g.round(1)
g = g.T
x = g.index
y =
#将表中的数值型数据保留小数位数1位
#将表格数据进行转置,转置后如图c所示
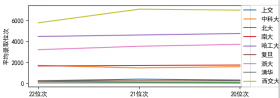
plt.plot(x,y,label=list(g.columns))
plt.ylabel('平均录取位次')
plt.xlabel('年份')
#显示图例,代码略
plt.show()
|
图 a |
图 b |
|
图 c | |